This series of tutorials – KNIME for beginners – introduces KNIME version 3 from the ground up through some real-life examples and applications. It is recommended that you follow along and try out each step by yourself.
KNIME, pronounced “nime” like in “lime”, is an open source end-to-end data analytics tool which can be used to solve a wide range of problems in science and in business.
Thanks to its intuitive visual way of working, KNIME can be quickly mastered also by non-technical users. KNIME has a broad user community which provides support and develops additional components to extend its capabilities and range of applications.
When more flexibility is required, KNIME natively integrates with a wide range of programming languages such as Java, R, Python and many more.
DOWNLOAD AND INSTALLATION
KNIME Personal Productivity is available for free from the knime.org web site. Go to knime.org and click on Download Now from the homepage.

If you wish to receive updates about KNIME and register to the forum, you can fill the form in step 1, otherwise you can move directly to step 2 by clicking on Download KNIME.
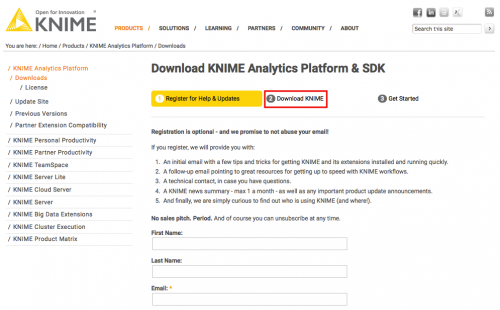
Scroll down until you see the version corresponding to your operating system. If your machine supports it, you should choose the 64-bit version. Depending on the space available on your hard drive, you may opt for a version including all free extensions. These extensions can also be installed later on, directly from within KNIME.
Click on the version you wish to download, accept the Terms and Conditions and click the Download button.
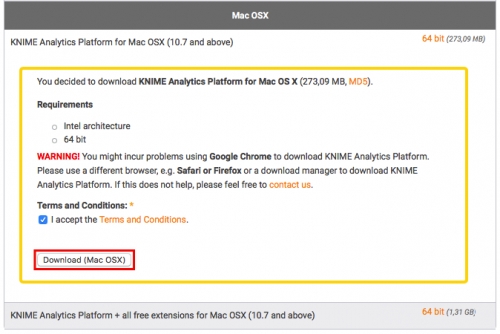
Once the download is complete, run the installer and follow the instructions on the screen.
When the installer has completed its task, KNIME is ready to run.
FIRST RUN
Start KNIME by clicking or double-clicking on its icon. If you are using an OS X based system, the first time you run KNIME you may see an error message saying that the application is not signed. If this happens, browse through your Applications folder, right-click on KNIME and choose “Open” from the pop-up menu. This will no longer be necessary after the first run.
Upon starting KNIME for the first time, you will be asked a location for your local workflows. At this point just confirm the default one. You will be able to change it later on if needed.
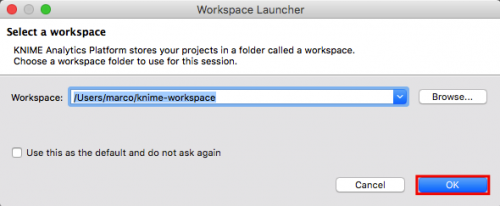
KNIME WORKSPACE
The Knime workspace is divided into several areas, each one with a specific function.
Top-left is the KNIME Explorer, showing the available Workflows, including some examples from the KNIME central server. Workflows are a key concept in KNIME and we will deep dive into them shortly. Under LOCAL Local Workspace you should see the Example Workflow. If you don’t see it, click on the little black arrow pointing right to expand the folder. Then double click on the Example Workflow to open it inside the KNIME workspace.

Below the Explorer is the Favorite Nodes area and below it the Node Repository. KNIME workflows are created by connecting different nodes. This area is where you will search for and select the nodes necessary to build your workflows.

The central area, which currently displays the Example Workflow we just opened, is where KNIME workflows are created, edited and run.
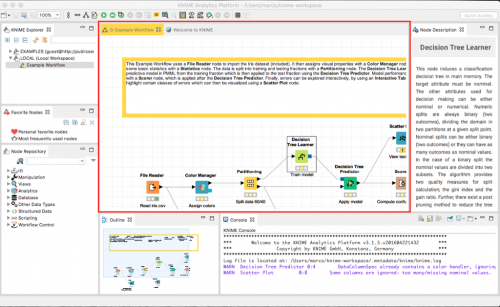
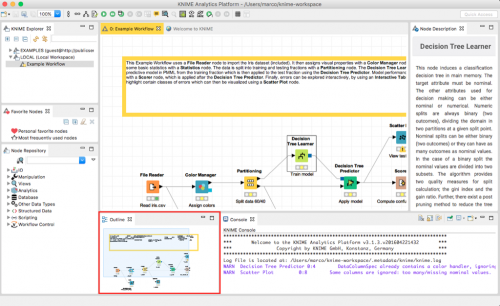
The Outline area below it acts as a visual navigation map for very large workflows. You can click in it with your mouse to move the visualisation of the main area to that portion of the workflow.
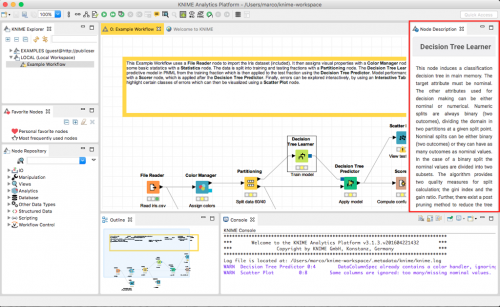
Top-left is the Node Description area. When you open the Example Workflow it shows the description for the Decision Tree Learner node, which is the one currently selected within the workflow. Try to click on other nodes in the Example Workflow to see their description appear in the Node Description Area.
Last but not least, bottom-left is the Console. Here is where all important messages, including Warning and Errors, are displayed.

Any area within the KNIME workspace can be resized by dragging its borders, minimized, maximized and even closed. If you accidentally close an area, you can display it again using the View menu.
There are other two areas we did not mention so far. At the very top of the KNIME application window is the Toolbar, containing buttons to accomplish various tasks. Depending on the status of the current workflow and which nodes are selected, the buttons on the toolbar may be enabled or temporarily greyed out.
At the very bottom is the status bar, which displays various messages during the execution of a workflow or during other tasks like downloads and updates. Since no workflow is running at this point, the status bar is empty.
RUNNING YOUR FIRST WORKFLOW
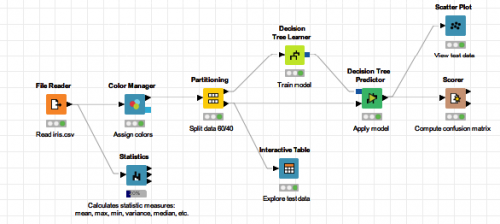
Let’s now look more closely at the Example Workflow. If your screen resolution is such that the workflow doesn’t entirely fit in the central area, you can use the zoom selector on the toolbar to reduce its size. Set it for example to 75% or 50%.
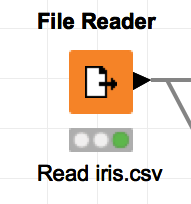
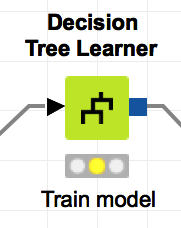
In the workflow each node, the coloured blocks connected one another with lines, has a traffic light below it. This traffic light indicates the readiness status of that node.
If it’s green, like for the File Reader node, it means the node has already been executed and has completed its job.
If it’s yellow, like for the Decision Tree Learner node, it means the node is properly configured and ready to be executed, but has not completed its job yet.
Finally, if it’s red, it means the node is not yet configured and cannot be executed until it has been properly setup. When nodes are first added to a workflow they are typically be red, indicating they need to be configured or connected to other nodes before they can be executed.
To see what a “red” node looks like, click in the Example Workflow on the connection line between the File Reader node and the Statistics node. The connection is made active as represented by the three little black dots appearing at its start, mid and end point.
Right click on the connection. A pop-up menu appears. Choose the last entry, X Delete, from the menu. A pop-up window appears asking to confirm the deletion of the connection. Click OK to confirm. The connection between the two nodes has been deleted and the traffic light under the Statistics node is now red. This is because the Statistics node has lost its input from the File Reader node and has no data to execute on.

To put the connection back in place, press Ctrl-Z (Cmd-Z on a Mac) or select Edit –> Undo Delete from the main menu. The connection reappears and the traffic light under the Statistics node is now back to yellow, meaning the node is ready to execute.
Let’s now look at the Scatter plot node. Its traffic light has a warning symbol on it.

This means there is a potential problem with that node that needs to be verified before proceeding. To know more about the warning, bring your mouse cursor over it, wait one second and read the tooltip that appears briefly. In this case it says “Some columns are ignored: too many/missing values.”

Probably you already noted that the same warning also appears, together with another one regarding the Decision Tree Predictor, inside the console. Warnings in the console are identified by the abbreviation “WARN” at the beginning of the line.
For the time being you can ignore the two warnings and run the workflow. When you execute a KNIME workflow you can run it in three different ways:
- Partially: run only the selected nodes.
- Fully: run all nodes.
- Fully with view: run all nodes and displays the first view.
You will learn more about what views are later on.
Nodes are always executed by KNIME following the order of the connecting arrows, typically from left to right and from the inputs to the outputs. KNIME takes automatically care of determining the proper execution order for your workflow.
To fully run the Example Workflow, click on the green button with the double white arrow (fast forward) in the command bar or choose Node –> Execute All from the main menu.
Note that some of the nodes execute quickly, as indicated by their traffic light turning green, while others take more time to complete. For those nodes that take longer to complete, the traffic light temporarily turns into a progress bar, showing the percentage of completion. Eventually all nodes turn green indicating that the workflow has been fully executed.
VIEWS
Now that the Example Workflow has been fully executed, we can display its output. This workflow has two main output nodes (rightmost nodes), one Scatter Plot and one Scorer (Confusion Matrix).

The Statistics node and the Interactive Table node are also additional output nodes of this workflow. Note where they are connected. These two nodes do not display the final output of the workflow but are used to display some intermediate results. This is often the case with complex workflows for which you want to check some intermediate results or monitor what happens after some critical steps.

Back to the main output nodes, to visualize the Scatter Plot right click on the corresponding Node and choose View: Scatter Plot from the pop-up menu.

A separate window with the scatter plot is displayed on top of the KNIME Workspace. This is an example of graphical View within KNIME and there are many others available to use in your workflows.

Close the Scatter Plot window by clicking the closing button or choosing File –> Close from its own main menu.
Now right click on the Scorer and chose View: Confusion matrix from the pop-up menu. A new window with the view appears on top of the KNIME Workspace. This view is displayed in a tabular formar as appropriate for its content. In case you are not familiar with the concept of Confusion Matrix, don’t bother too much with it right now, we will cover it in one of the next parts.
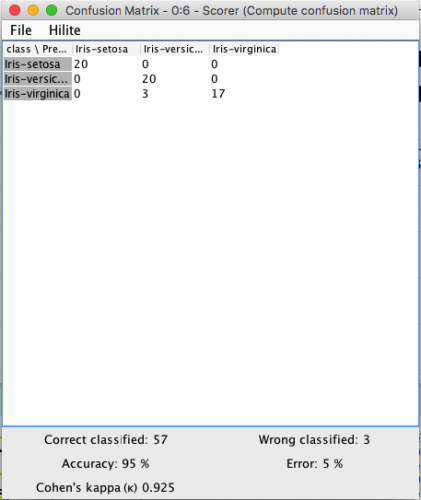
You can now close the Confusion Matrix window and go back to the Example Workflow.
WORKFLOW ANNOTATIONS
At the top of the Example Workflow there is some text surrounded by a yellow frame. This is a Workflow annotations. You can add workflows annotations to describe your workflow, provide instructions or make important sections stand out from the rest.

Workflow annotations can be moved around by dragging with your mouse the cross arrow that appears when you hover with the cursor over their top-left corner.
As you click the arrow, note that some handles (the black tiny square dots) appear around the annotation, indicating it can be resized. Drag the handles with the mouse to resize the annotation.

To edit the text within an annotation, click once the four pointed arrow to make it active, then the double click anywhere inside it to make it editable. You can now edit the text inside the annotation.
Annotations support colors (background and border) and text styles. To change any of them, make sure you are in annotation editing mode, then right click anywhere on the annotation. A pop-up menu is displayed allowing you to change Background color, text Alignment, Border color. In order for the Font Style… option to be active, you first need to select a portion of text within the annotation.
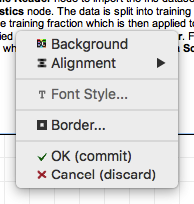
When you are satisfied with the changes to your annotation, you can simply click outside of it to confirm them and exit the editing mode. As an alternative, you can right click while in editing mode and choose Ok (commit) from the pop-up menu. On the other hand, if you wish to discard any changes you just made to the annotation, right click while in editing mode and chose Cancel (discard) from the pop-up menu.
Working with annotations in KNIME may feel a bit cumbersome at first, but you will quickly get hold of how they work.
One important aspect to note is that Workflow annotations always appear behind the nodes, hence they can be used to visually enclose, separate and name different sections of a workflow. Many KNIME examples use workflow annotations exactly for this purpose.
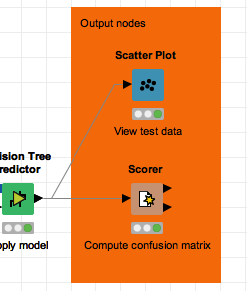
For example, let’s add a workflow annotation to the Example Workflow to visually indicate its output section.
Right click on an empty area of the workflow and choose New Workflow Annotation from the pop-up menu. A new annotation is created in the point where you originally right clicked with your mouse. You can now edit the annotation as described earlier.
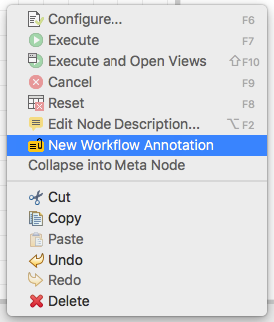
Change its text to “Output nodes”, its background color to orange and its border color also to orange. As an alternative, you can set border size to 0 within the Border color dialog. Now drag the annotation and resize it so it encloses both the Scatter Plot and the Scorer nodes. You may have to make it a bit taller so that the Output nodes text doesn’t overlap with the description of the Scatter Plot node. We have created a nice visual cue about which ones are the main output nodes of our workflow.
NODE NAMES AND NODE DESCRIPTIONS
In KNIME each node has a Name, which is displayed above it in bold and indicates its function, and a description, which is displayed below its traffic light.
Node names cannot be modified by the user, but they can be hidden by choosing Node –> Hide Node Names from the main menu. To display them again if hidden, repeat the previous command. There is also a dedicated button with the same function on the command bar.
Node descriptions on the other hand can be modified by the user and they are typically used to provide some more information about the specific function of each node within the context of that particular workflow.
To edit a node description, double click on it. Node descriptions can consist of a single line or multiple lines. To create an extra line in the node description, press Enter on the keyboard while editing. To stop editing a node description, either click with the mouse outside the node description or press Esc on the keyboard.
Try editing the description of the Statistics node inside the Example Workflow to break the second line, which is quite long, into two.

REARRANGING NODES
One of the main advantages of KNIME is definitely its visual way of working. When workflows are properly organized and laid out it is relatively easy to go over them, follow the flow through the different nodes and ultimately understand what they are meant to do. For this reason it is important that your workflows, beside being properly documented, are kept visually organized in a meaningful way. While a “messy” workflow will still run fine within KNIME as long as all nodes are properly connected and configured, it will be extremely difficult to interpret and modify later on should the need arise.
Within KNIME nodes can be re-positioned within a workflow to improve its visual appearance. Typically a workflow is arranged in a left to right fashion, with the leftmost nodes being the input and the rightmost nodes being the output. The nodes in the middle usually perform data transformations and analysis.
Nodes that act on the exact same data or that logically execute at the same time are usually positioned one above the other, vertically distributed. For example, the Color Manager node and the Statistics node in the Example Workflow follow this convention.
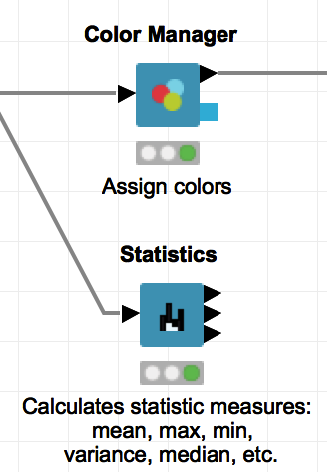
To reposition a node, click on it and drag it with your mouse. If the node is connected to other nodes, the connections will stretch to follow its new position. In other words, re-positioning an already connected node does not break its connections.
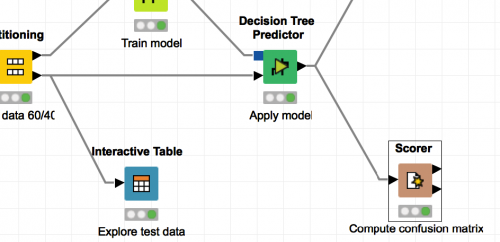
In the Example Workflow, try moving the Scorer node down to position it at the same horizontal level of the Interactive Table node.
REARRANGING CONNECTIONS
Once a node which is connected to other nodes is moved to a new position, it may happen that its connections stretch in a way that they overlap other nodes or other connections, making the workflow difficult to read. KNIME has a solution for this issue as well.
Connections can be easily re-routed and re-shaped without breaking them.
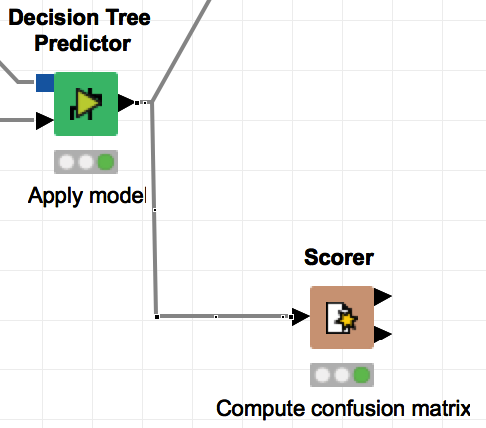
To add an extra bend point to a connection, click on it to activate it, then move the mouse cursor over its mid point where a tiny black handle has appeared. The cursor turns into a cross. Drag the mid point with the mouse. This creates and extra bend point which can be positioned anywhere. The modified connection is now divided into two segments. Note that each of the segments has an own mid point which can be also dragged to route and shape the connection as necessary. Additional handles, which also create new bend points, are available close to the beginning and the the end of the connection line.

Once you are done editing a particular connection, click anywhere outside of it or press the Esc key on the keyboard.
In the Example Workflow, try to add an extra bend to the connection between the Decision Tree Predictor node and the Scorer node we just moved down. Make it a right angle so it looks visually pleasent.
CLOSING A WORKFLOW
When you are done working with a workflow, you can close it by clicking the X symbol on the workflow tab or by right clicking on the same tab and choosing Close from the pop-up menu.

If the workflow has been modified since it was opened, KNIME will propose to save the changes. Click Yes to save the changes, No to discard them or Cancel to go back to editing the workflow.

CONCLUSION
This concludes the first part of this series. In Part 2 we will learn how to create, configure and execute a workflow from scratch. Please feel free to leave your feedback and comments below.

One response to “KNIME for beginners – Part 1”
Thank you for your tutorials. I find them very useful and clear.