In this Part 2 you are going to create your first KNIME workflow from scratch. If you haven’t read Part 1 yet, you may consider stopping here and going through it first.
CREATING A NEW WORKFLOW
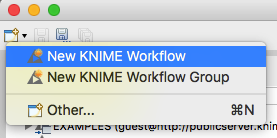
To create a new empty workflow in KNIME, chose File –> New from the main menu or click the down arrow close to the left-most button on the command bar and choose New Knime Workflow.
A window opens asking to enter the name for the new workflow and a destination path which by default should be LOCAL. Name the workflow My first KNIME workflow, leave the Destination path unchanged and click Finish.
KNIME creates a new empty workflow ready for you to work with. Note that the newly created workflow appears under LOCAL (Local Workspace) inside the KNIME Explorer. You may have to click the little triangle on the left side of this voice to expand the contained list and see the name of your new workspace.
ADDING A NODE TO THE WORKFLOW
We are going to create a very simple workflow that takes a series of numbers as input and outputs some statistics on them.
First you need to add a node capable of generating your input, namely the series of numbers. Very often input data are generated by reading external files like Excel spreadsheets or Comma Separated Values (CSV) files, or by connecting to data sources like databases. KNIME has input nodes able to deal with a large number of different data sources.
While building a workflow it may be useful to use only few selected test data to try it out. Working with a smaller data set has the advantage that the workflow runs faster and corrections can be made more quickly in an iterative way.
A useful node that can be used to generate a limited set of test data to use in KNIME is the Table Creator node. Let’s add it to the newly created workflow.
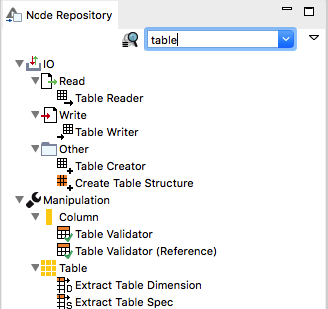
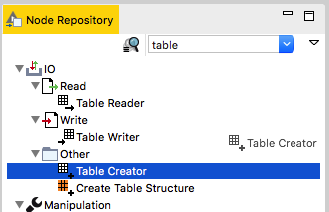
Go to the Node Repository panel (bottom left area of the KNIME workspace) and start typing the word “table” in the search box. As you type, the list of nodes changes to reflect your search term. Only the nodes whose description contains the search term will be listed.
Scroll down until you see the Table Creator node (hint: it’s under IO –> Other). To add this node to the workflow, you can either click it and drag it from the Node Repository to the empty workflow page in the position you prefer OR double click it directly in the Node Repository, which positions it directly in the center of the workflow page. From here you can move it to a different position on the page. Being an input node, it should usually be positioned on the left side of the page.
CONFIGURING THE TABLE CREATOR NODE
The Table Creator node you just added is not yet configured to generate the input you need for your workflow. But, wait a moment, its traffic light is yellow, doesn’t that mean it is configured and ready to run? Well, yes and no. Bear with me, it will make perfectly sense in a moment.

Many KNIME nodes have a default configuration which makes them suitable to be run as is, fresh out of the Node Repository. In the case of the Table Creator node, its default configuration tells it to output a totally empty table. Fully legitimate, but not very useful!
You can try to run the workflow with just the Table Creator node in it to see the effect of the default configuration. The traffic lights for the Table Creator node turns green to indicate a successful execution, but at the same time a warning sign appears on top of it.
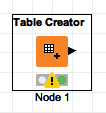
By looking at the console (or hovering with the mouse over the warning sign) you will note a new WARNing saying “Node created an empty data table.” This is exactly what we expected to happen since the node has been executed with its default configuration.
Time to add some meaningful data to the Table Creator node. Right click on the node and choose Configure… from the pop-up menu. As an alternative, you can select the node with a click of the mouse and choose Node –> Configure… from the main menu.
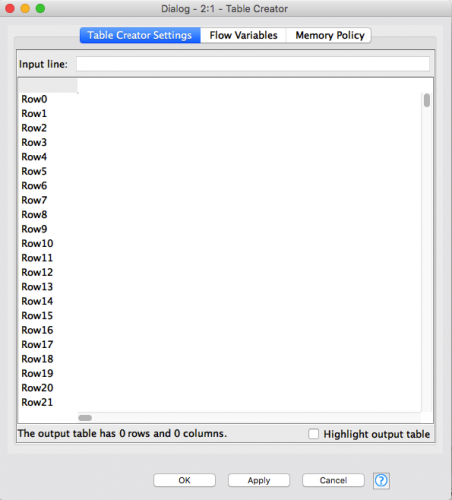
A new dialog window for the configuration of the Table Creator node opens. The configuration dialog is organized into tabs. If you are using a Windows system, there are four of them in the case of the Table Creator node, “Table Creator Settings”, “Flow Variables”, “Job Manager Selection”, “Memory Policy”. If you are using a Mac the “Job Manager Selection” tab does not appear. Note that, in general, each node type has a specific configuration window with a different type and number of tabs. Few tabs however, like “Memory Policy” or “Flow variables”, appear in almost all nodes.
To move between the different configuration tabs just click with the mouse over their name.
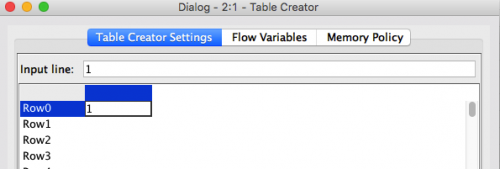
Let’s now enter some input data in the Table Creator node. Move to the Table Creator Settings in the configuration dialog and double click on the first empty cell in the top left corner (immediately on the right side of the row named Row0).
As you do that, you will be able to type into the cell. Type the number “1”, then press the arrow down key on your keyboard if you are using a Windows system or Enter if you are using a Mac.
Two things happen at this point:
1) The cursor automatically moves to the next row (Row2)
2) The column you typed in gets an automatically assigned a name, namely “column1”
Note that the names of the columns, as well as the names of the rows such as Row1, Row2 etc. can be modified by double-clicking on them. For the sake of this example we will leave them unchanged.
With the cursor now on the second row (Row2) type “2” and press arrow down on the keyboard.
Keep entering the sequence from 1 to 10, one after the other. You should end with “10” on Row9. At the bottom of the table you should read The output table has 10 rows and 1 columns. This confirms the configuration has been setup the way we need.
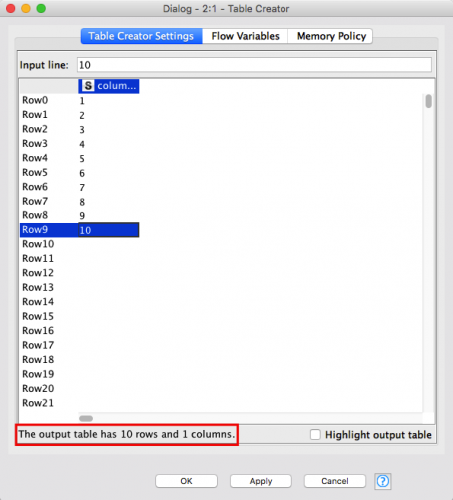
Click the OK button to confirm the configuration and close the configuration dialog. Clicking the Apply button instead confirms the configuration but keeps the dialog open for further edits. The Cancel button closes the configuration dialog discarding all changes made to the configuration of the node.
As you click to OK button a message window appears, warning that by changing the configuration of this node KNIME will have to reset it together with all the other nodes connected to it. This makes perfectly sense since we are changing a node that could potentially feed other notes, requiring a re-execution of the workflow to update the output.
Click OK to confirm that is fine to reset this node (actually there are no other nodes beside this at the moment). This closes the configuration window and brings you back to the workflow editor.
Once back to the editor, note that the Table Creator node is back to yellow. Let’s run it to check if, now that is configured, we don’t get any longer the warning message.
Right click on the Table Creator node and choose Execute from the pop-up menu. The node is executed, as shown by the traffic light turning green, this time without a warning.
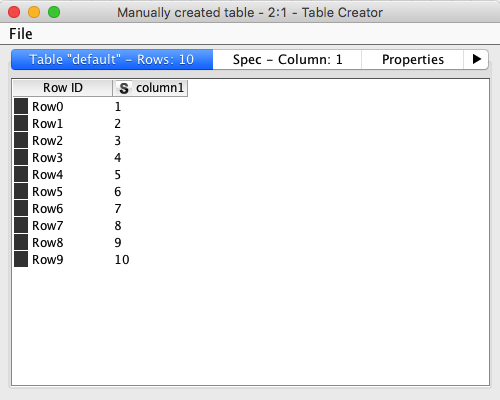
With nodes like the Table Creator you can check their intended output even without a view node connected to them. To do that, right click on the node after it has been executed and choose the last entry from the pop-up menu. In the case of the Table Creator node this entry is named “Manually created table”, but the name changes from node to node to reflect the content of the view. Some nodes may even have multiple internal views as we are going to learn later on.
A new window is displayed showing the content of the table. This window allows you to also investigate the Spec of the table, its Properties and its Flow Variables. More about these topics later on.
DATA TYPES IN KNIME
Note that in this view the “column1” column name of the table is marked with an “S” symbol. This symbol indicates the type of data contained in that column. “S” stand for strings, which in KNIME’s world means text. KNIME can work with many different type of data. The most widely used ones are:
Number, divided in:
I –> Integer
D–> Double precision (number with decimals)
L –> Long (like Integer, but with many more digits)
Boolean value:
0 or 1, TRUE or FALSE
String
Text based data
Remember that we intend to do some numerical calculations later on with our data, but KNIME seems to be interpreting them as strings (text) right now. In general strings are not suitable for mathematical calculations unless they are first converted back to numbers. We need to fix this before proceeding.
Close the dialog, go back to the node, right click on it and choose once again Configure from the pop-up menu.
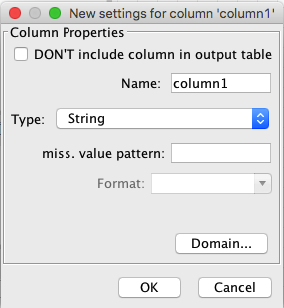
In the Table Creator Settings tab, double click on the “column1” column header (which now displays the “S” data type as well) to open the column property dialog.
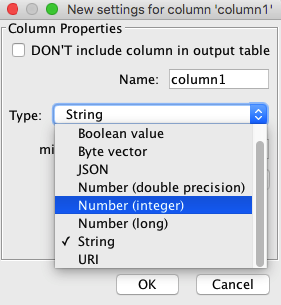
In the Type drop-down list, which currently shows String, choose Number (integer) then click OK to confirm the change.
Back to the configuration dialog, note that now “column1” is marked with a “I” symbol (for Integer) and that the numbers are right aligned while earlier they were left aligned. Both are visual indications that the content of our table has been converted to numbers, namely to integers. This is exactly what we need for the next step.

Close the configuration dialog by clicking on Ok and, if asked, confirm that all nodes can be reset.
ADDING AN ANALYSIS NODE
Now that the input table is properly configured, it is time to add an analysis node that calculates some summary statistics on it. Go back to the Node Repository, delete the previous search entry and type “statistics” in the search box.
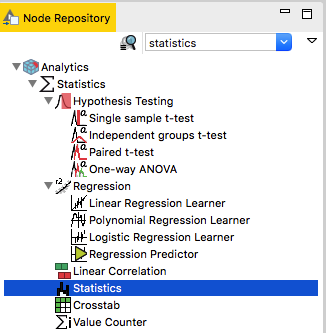
Depending on the extensions you have installed, a number of nodes will be displayed. Under Analytics –> Statistics choose the one named “Statistics” and drag it to the workflow. Position it to the right of the Table Creator, approximately at the same horizontal level.
CONNECTING THE NODES
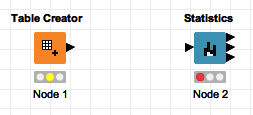
In order to do its job and calculate the summary statistics, the Statistic node needs to receive the input data generated by the Table Creator node. This is accomplished by connecting the output connector of the Table Creator node, the little black triangle on its right side pointing away from it, to the input connector of the Statistics node, the little black triangle on its left side pointing toward it.

To connect the two nodes, position the mouse cursor on the output connector of the Table Creator node, then click and drag away from it toward the input port of the Statistics node. As you do that, you will see the cursor changing to a tiny arrow with an electrical plug symbol below it. This is the indication you are creating a new connection out of the starting node. To the right side of the arrow a forbidden symbol (circle with a line through it) shows that there is nothing to connect to at that moment.
As you hold the left mouse button and move the cursor on top of the input connector of the Statistics node, the forbidden symbol disappears indicating you can release the mouse to create the connection between the two nodes.
Note that as soon as the connection is created, the traffic light under the Statistics node that earlier was red turns to yellow, indicating the node is configured and ready to execute. What has happened is that the act of establishing the connection has generated a default configuration for the Statistics node which is enough to make it suitable for execution. You can review the configuration by right clicking on the node and choosing Configure… from the pop-up menu.
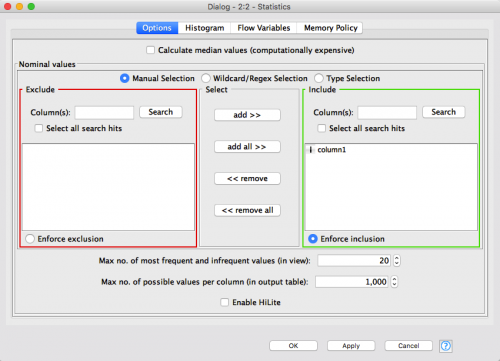
Note that in the Options tab the Include configuration box, the one with a green frame around it on the right side, contains “column1”. This is the name of our data column out of the Table Creator node which, through the connection, has been passed on to the Statistics node as part of the default configuration. This is very common in KNIME. As soon as the a connection is established between two nodes, the receiving node “learns” about the originating node and tries to configure itself in a useful manner.
Since this is exactly what we want in this case, you can simply click Cancel to exit the configuration dialog, right click on the Statistics node and choose Execute from the pop-up menu. The node is executed and the traffic light turns green.
To display the results of the Statistics node in a quick way we can use once more the internal viewing capabilities of the node itself. Right click on the node and choose View: Statistics view. A new window opens displaying the summary statistics of our data set and even an Histogram of the value distribution!
Note that in this view the histogram is built by default over 9 bins (groups). Since we have 10 values in total, 9 and 10 have been binned (grouped) together in the last bin, hence the last bar being double the height of the others.
VIEWING THE OUTPUT ON A DEDICATED NODE
The Statistics node has 3 output connectors. If you click on the node and scroll to the bottom of the Node Description on the right side, you will find an indication of what these outputs correspond to.

The port number 0 is the topmost one, port number 1 is in the middle, port number 2 is the bottom one. In the reference documentation ports are always numbered top to bottom, starting with 0.
We are now interested in displaying the output from Port 0, Table with numeric values, in an own dedicated node. Since the form of the output is a table, we need to look for a node capable of displaying tables.
In the Node Repository, delete the previous search term and press enter to list the entire content. This action removes the search filter and displays all available nodes. The nodes are organised in a hierarchy and are grouped under use areas. Many of the most widely used nodes fall under these four categories:
IO is for Input/Output nodes. These nodes can, for example, read and write files or read and write from a database.
Manipulation collects nodes that transform data in different ways. For example adding an extra column or removing an existing one.
Views is for displaying output within KNIME. For example, if you want to display your data in a plot format, this is where to look.
Analytics groups nodes specialised for data mining and statistics. For example, the Statistics node we used before belongs in here.
Depending on the installed extensions there could be many more categories available, ranging from Scripting to Chemistry to Social Media.
Since we want to display the output of the Statistics node within KNIME, opposed to, say, saving it to a file, we need to look under Views. Click on the triangle on the left side of Views to expend the group. Scroll down and you should see a node called Interactive Table. This is a node often used for displaying data in a tabular format. It also provides some interactivity to the visualisation.
Click and drag the Interactive Table node to the workflow and position it to the right of the Statistics node. Then connect the output Port 0 of the Statistics node to the input port of the Interactive Table node. By this time you should have mastered how to make connections between nodes! Here is a anyway a neat trick. If you preselect a node in the workflow editor and then double click on a node in the Node Repository to add it to the workflow, it will be automatically connected o the previously selected node. A great time saver, isn’t it?
As you establish the connection the Interactive Table node turns yellow indicating it is ready to execute. Right click on it to open the pop-up menu.

Note that KNIME nodes that are capable of generating a View have an additional execution command available to them, Execute and Open Views. By choosing this option the node is executed and the associated View is automatically displayed. If you would simply Execute this kind of nodes, the view would not displayed until you right click again on the node and choose the View command from the pop-up menu (View: Table view in the case of the Interactive Table node). The Execute and Open Views command is an handy shortcut since it does both operations for you.
Go on and click on Execute and Open Views. As the node has finished executing, which should be really fast given the low amount of data, the View window opens. The information displayed may remind you of the internal view of the Statistics node. As a matter of fact the two views are quite similar, but this one has been generated by a dedicated view node.
Dedicated view nodes have more flexibility than internal view nodes. For example, look at the main menu of the window. You have the option, through the Output menu, to save your view to a CSV file. You can also select and highlight some of the data. More about highlighting later on.
You may also want to experiment with the options under the View menu or trying resizing some of the columns in the view by dragging the separation border between them. If you are familiar with Microsoft Excel, this view behaves similarly to a mini Excel sheet.
You can now close the View window and go back to your workflow. Before closing KNIME, you should save your workflow by choosing File –> Save or clicking the save icon on the command bar. If you happen to forget to save your workflows, KNIME will kindly ask you before quitting. As your workflows get more complex and the amount of data grow, you should remember to save often your progresses. Additionally you can setup KNIME to autosave your workflows at regular intervals to prevent any potential loss of your work.
CONCLUSION
This concludes part 2 of this tutorial. In part 3 we are going to explore some more advanced visualisation and analytics, work with highlights and expand KNIME by adding new components to it.
