Tag: qplot
-
Sales Dashboard in R with qplot and ggplot2 – Part 3
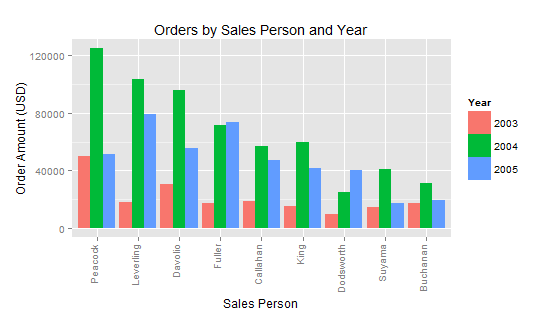
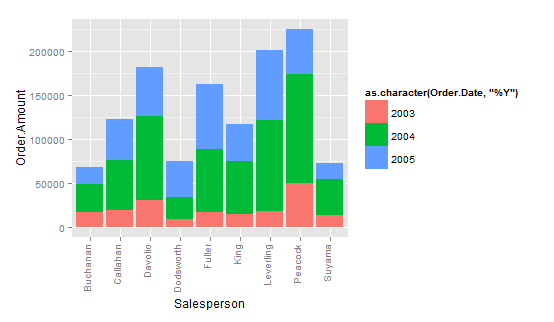
In Part 3 of this series we will explore some more variations to our Sales Dashboard in R and introduce […]
-
Sales Dashboard in R with qplot and ggplot2 – Part 2
In Part 1 of this series we moved the first steps into building our Sales Dashboard in R. In this […]
-
Sales Dashboard in R with qplot and ggplot2 – Part 1
In a previous post about creating Pivot Tables in R with melt and cast we covered a simple way to generate sales reports […]
-
Identifying outliers in R with ggplot2
One of the first steps when working with a fresh data set is to plot its values to identify patterns […]


